![]()
| The information below will
help you navigate around the pages which show information
for each station |
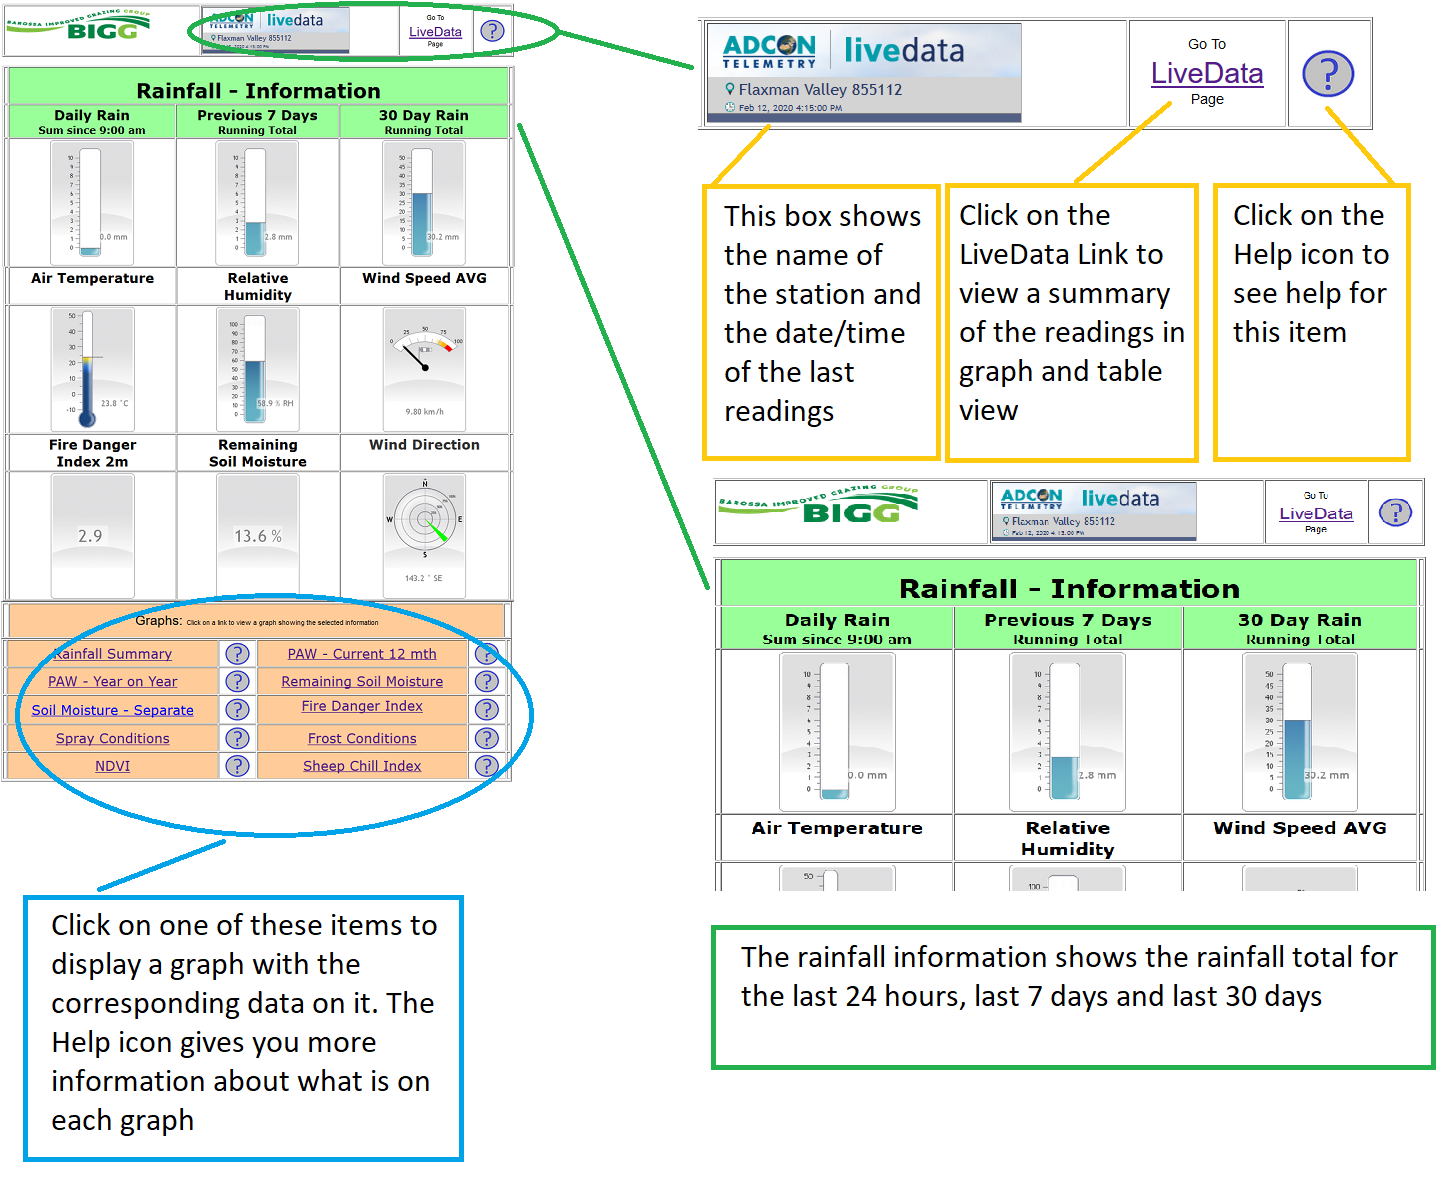 |
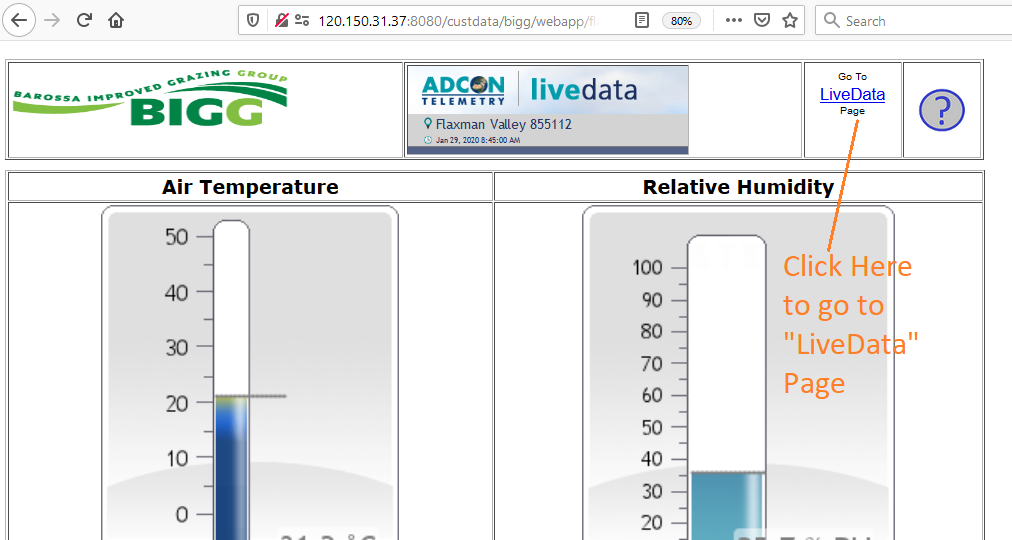
| LiveData |
| LiveData is a function
built in to the addVANTAGE Pro software which is used to
produce the weather station summaries. Click on the "LiveData" link shown at the top right of the page to access the function. |
 |
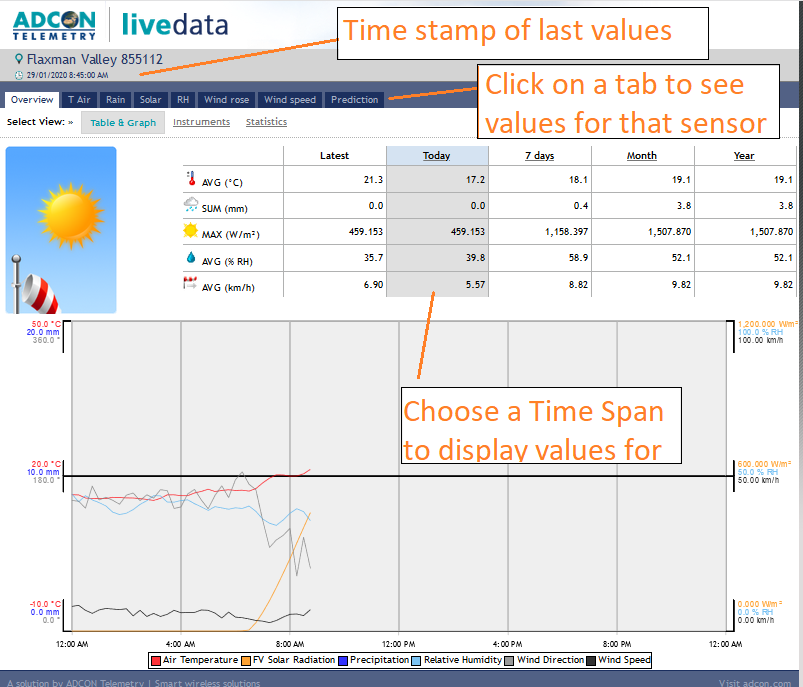
| The LiveData for each
station offers a summary page and an individual page
showing information for each of the primary weather
sensors. |
| Overview |
| On the Overview page you
can select several views: - Table and Graph: shows a table with a brief summary of the data and a graph showing values for the selected time period - Instruments: shows the latest value for each sensor on a "virtual Instrument" - Statistics: shows a summary of the data for the year |
 |
| Wind
Rose |
| The Wind Rose page shows a
summary of the wind speed and direction. |
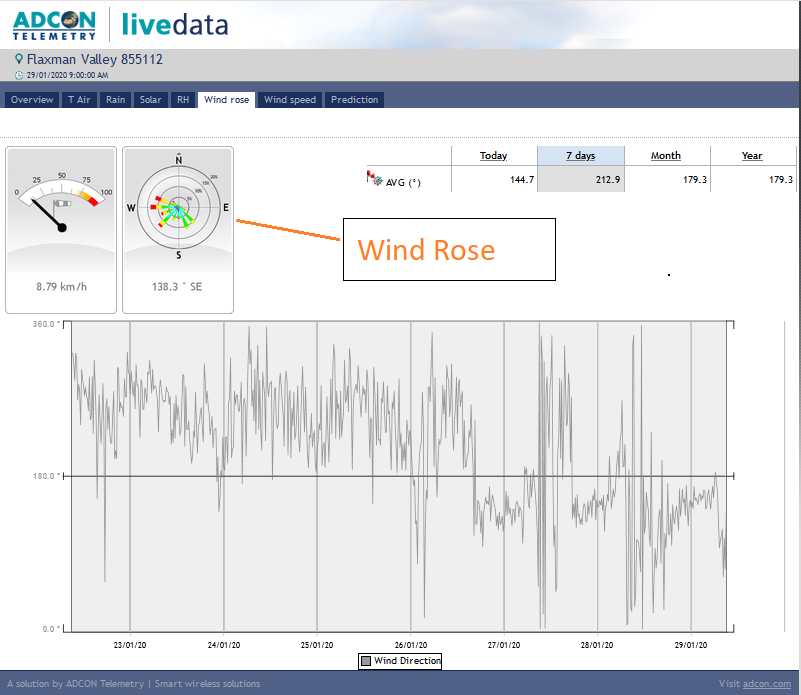 |
| The Wind Rose provides a
neat summary of the amount of wind which has blown in each
of the major points of the compass. If the wind blows from
the north for 1 hour at a speed of 30 km/h, that is
equivalent to a "run" of 30km north.When you select a time
period (e.g. 7 days) the display shows the amount of run
in each of the 16 compass points. |
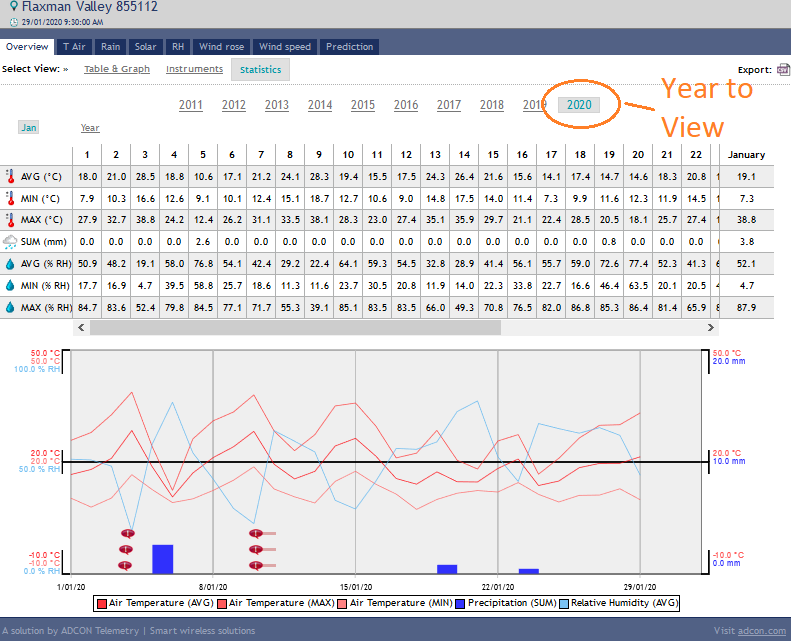
| Statistics |
| If you select the
Statistics link on the Overview page, the system will show
you an annual summary of the sensor data. The data for
each month of the year is shown in a tabular view. You can
then select the month to view. You can look back at
previous years to see how they compare to the current
season. |
 |
|
Powered by:
|
|